Troubleshooting
Packet Analysis with Wireshark
It is possible to inspect the over-the-wire interactions with Meerkat DSA using Wireshark, but it takes some initial configuration for Wireshark to work with it.
This will not be a tutorial on using Wireshark generally: only for configuring Wireshark to inspect your interactions with a DSA.
Whatever protocol you are inspecting, your first step is to select the network interface(s) on which you want to listen in Wireshark.
If you do not see the network interface on which you need to listen for traffic,
try starting Wireshark with administrative privileges. Usually, you need to be
an administrator / root to be able to capture raw packets from a network
interface.
When you do so, you will probably also want to filter for the TCP port on which the DSA whose traffic you are inspecting is listening.
Capturing Internet Directly-Mapped (IDM) Protocol Traffic
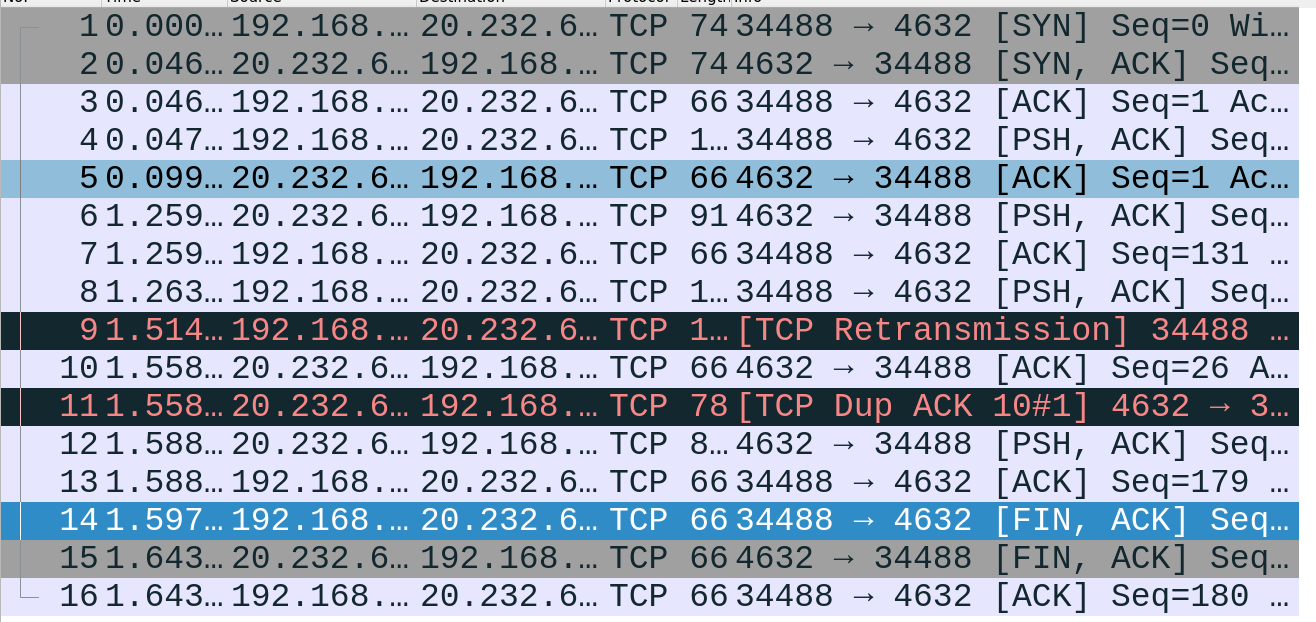
When you capture IDM traffic to and from a DSA, it will (most likely) show up in Wireshark as just TCP traffic. That's because Wireshark has no way of knowing that the traffic encapsulated in the TCP packets is IDM traffic.

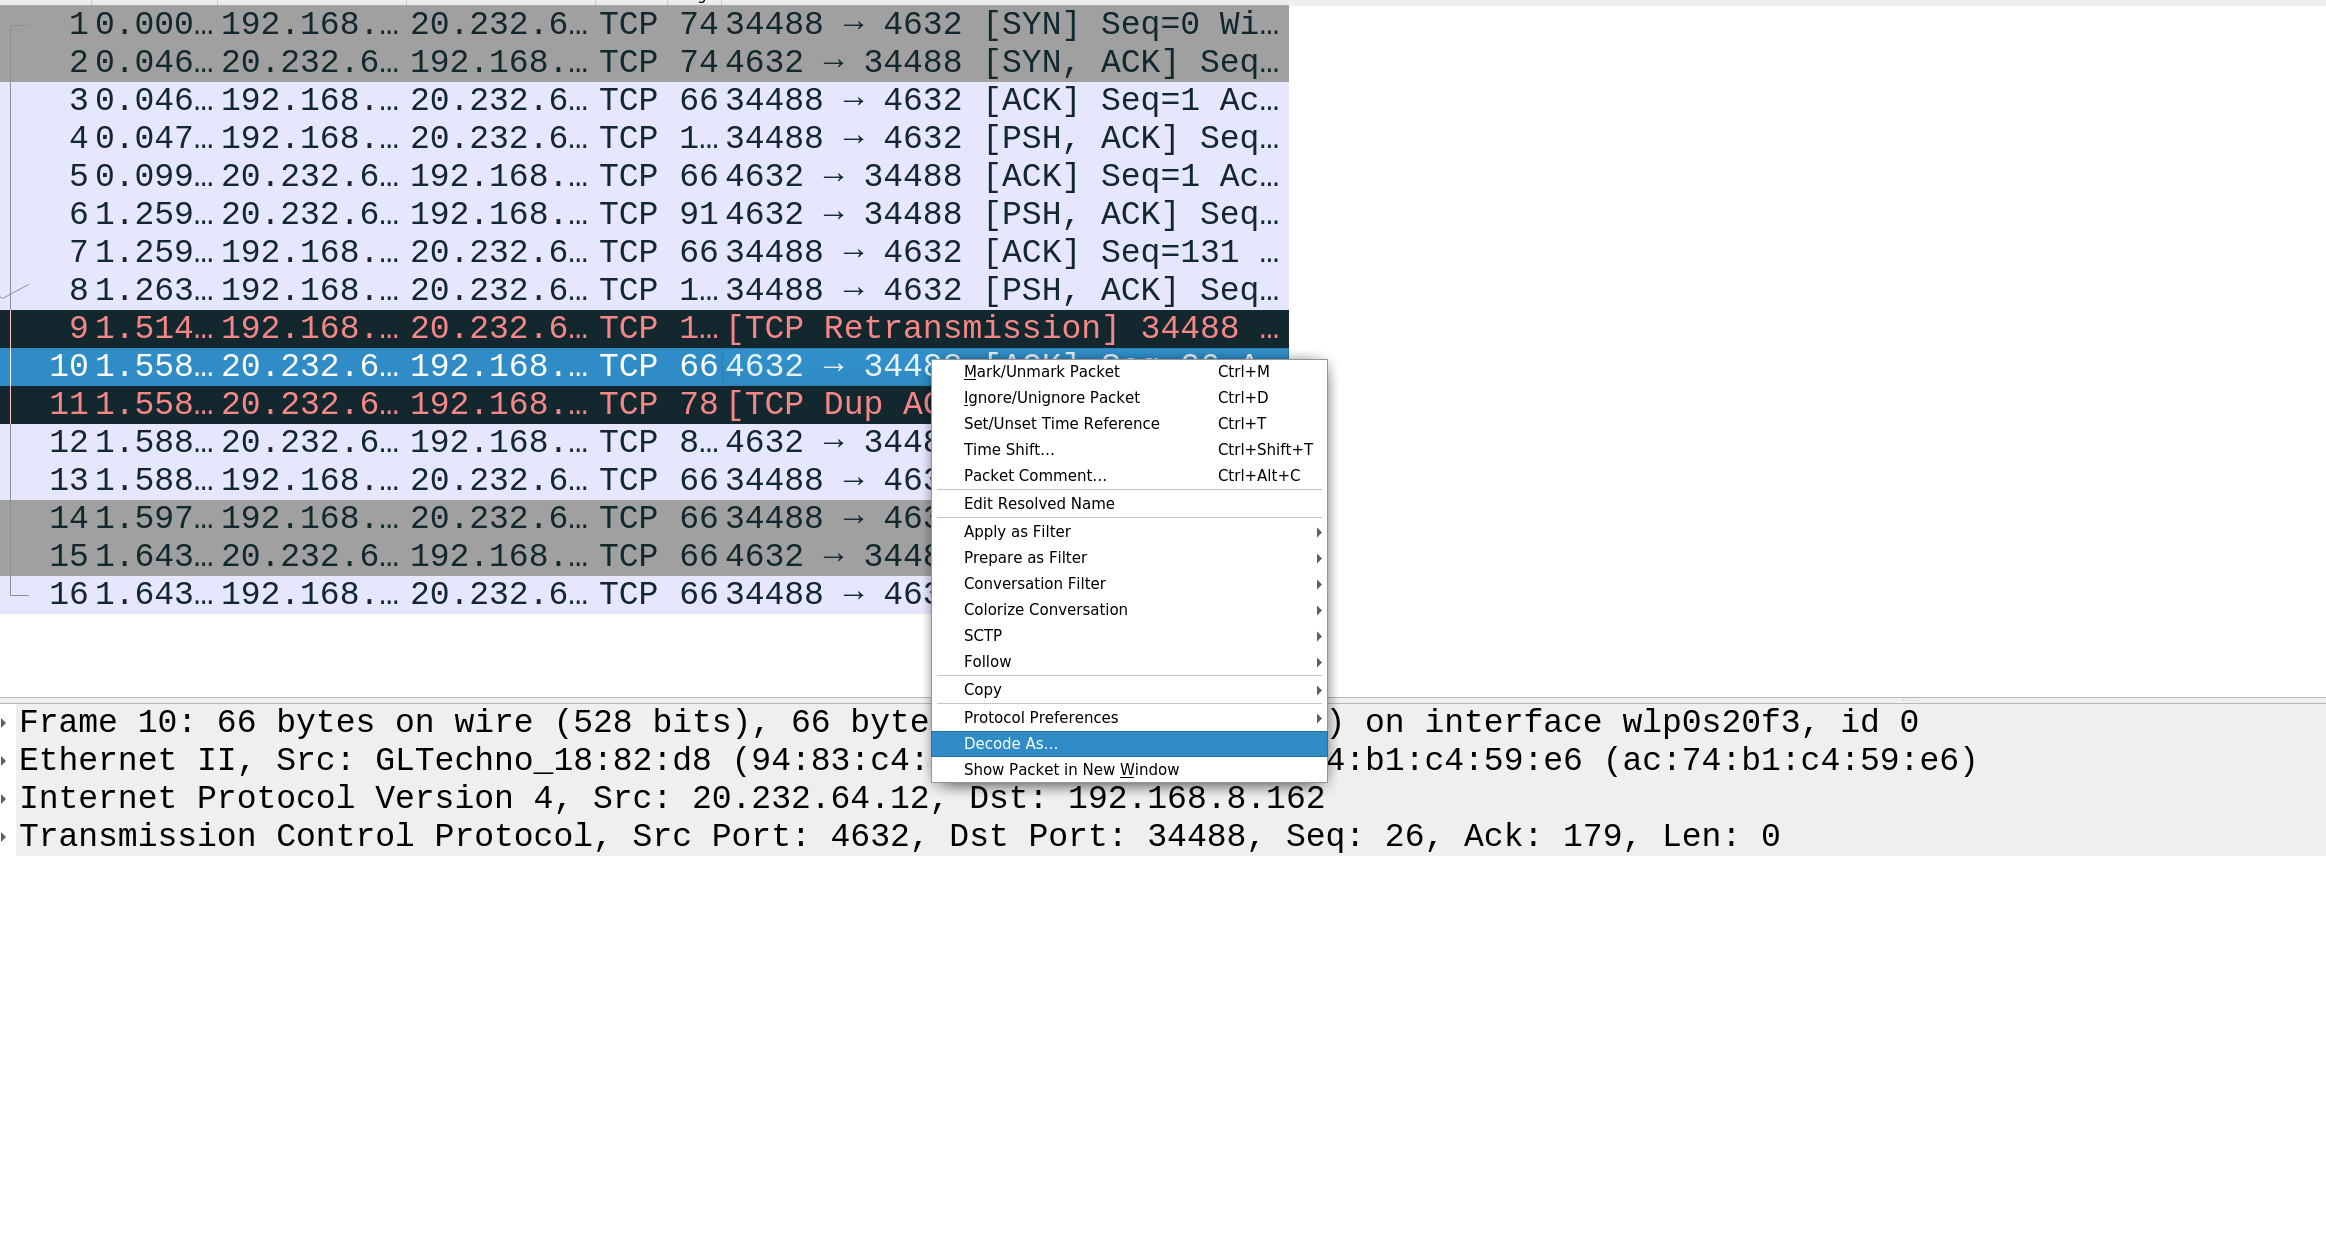
So you need to right-click on a TCP packet, and select "Decode As..."...

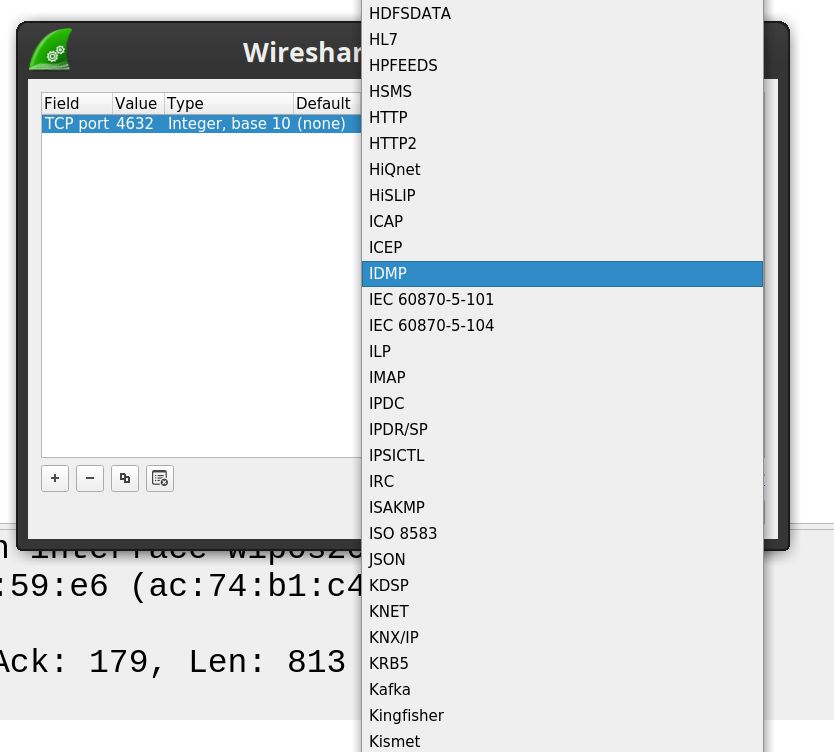
Then select "IDMP" and click "Save."

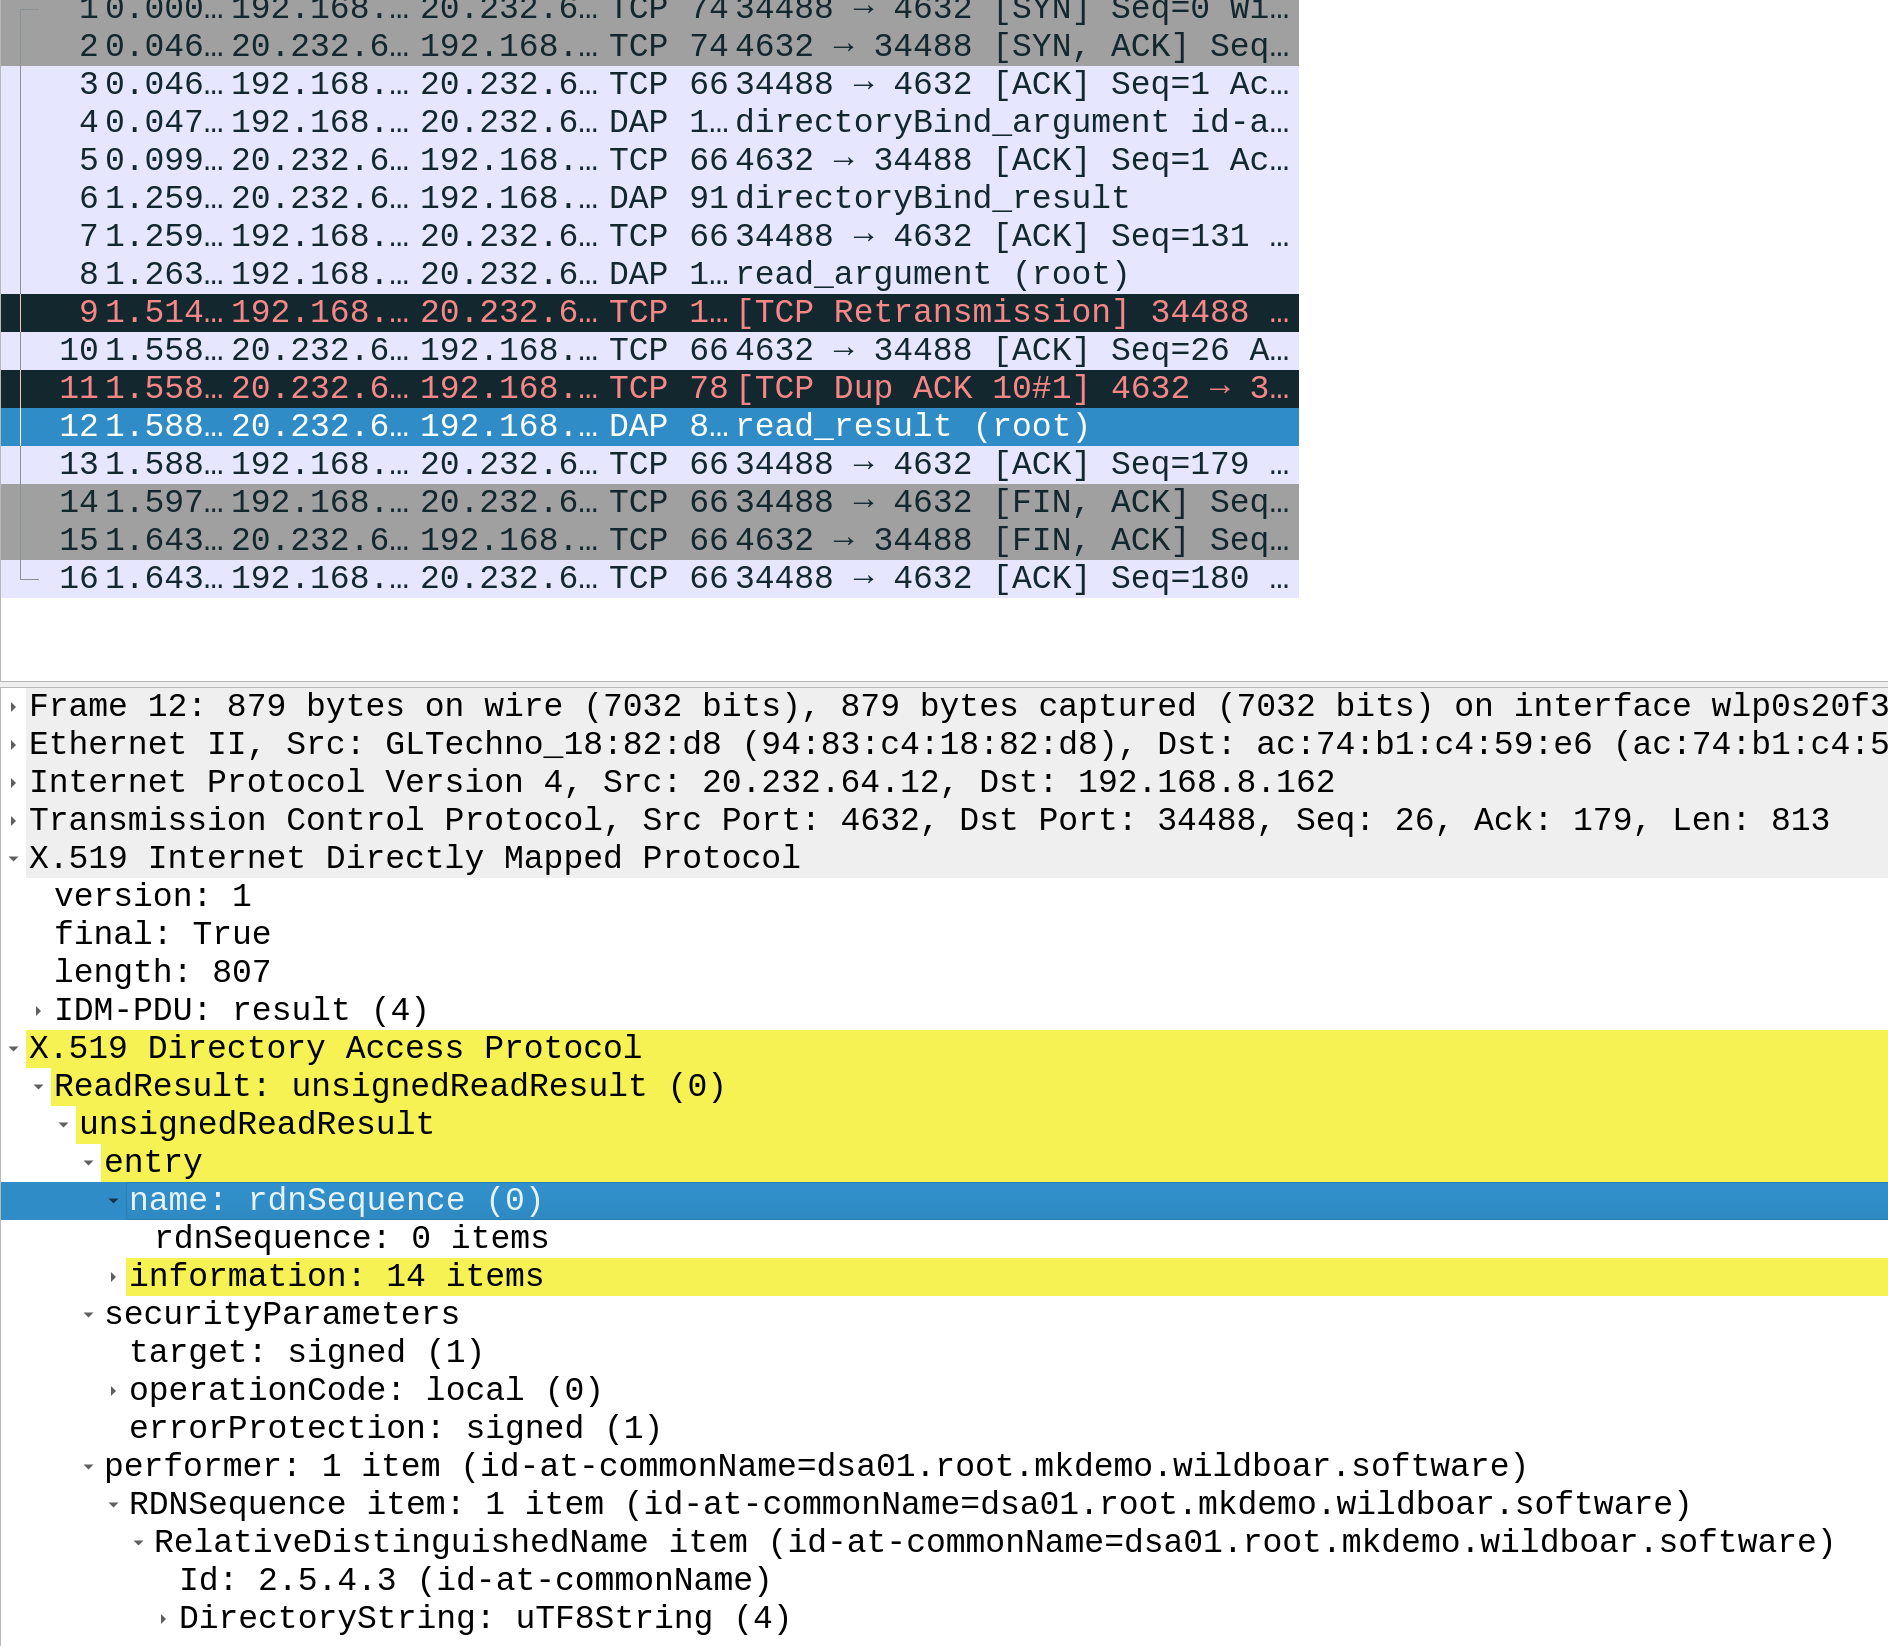
Then you can close the "Decode As..." window. After closing the Window, you should see your traffic displayed as "DAP", "DSP", "DOP", or "DISP", depending on what IDM protocol you used.

Capturing Lightweight Directory Access Protocol (LDAP) Trafic
If you are listening for LDAP traffic on a standard port (389 if unencrypted, or 636 if tunneled through TLS), Wireshark may just figure out that LDAP packets are being transported over TCP/TLS, but if you are not using a standard port, you may have to tell Wireshark to decode the raw TCP stream as LDAP packets using the instructions described above. Rather than selecting "IDMP" from the "Decode As..." popup, you would select "LDAP."